Concurrency 기초 — Concurrency vs Parallelism·Race·Memory Model
#한 줄 요약
“Concurrency는 처리할 일들의 조직이고, Parallelism은 동시 실행” 이라는 Rob Pike의 정의가 출발점입니다.
#Concurrency vs Parallelism
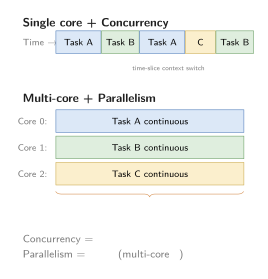
단일 코어 RTOS는 concurrency만 제공하고, SMP Linux는 둘 다 제공합니다.
#Race Condition — 정의
여러 thread가 순서 보장 없이 공유 자원에 접근하는 상황을 race condition이라 합니다.
int counter = 0;
void task1(void) { counter++; } // RMW: read, add 1, writevoid task2(void) { counter++; }가능한 결과:
Thread 1 Thread 2 counterread 0 read 0add → 1 add → 1write 1 write 1 ← 1 (잘못! 2여야)counter++는 실제로는 3개의 명령으로 나뉘기 때문에, 중간에 인터럽트가 들어올 수 있습니다.
#Atomic
#include <stdatomic.h>
atomic_int counter = 0;atomic_fetch_add(&counter, 1); // 원자적Hardware 지원으로는 ARM의 LDREX/STREX와 x86의 LOCK XADD가 대표적입니다.
; ARM atomic add1: ldrex r0, [r1] add r0, r0, #1 strex r2, r0, [r1] cbnz r2, 1b ; STREX 실패 (다른 thread가 끼어듦) → retry#Memory Model — 왜 필요한가
/* Thread 1 */x = 1;y = 1;
/* Thread 2 */if (y == 1) assert(x == 1); // ← 항상 참? OoO·cache 때문에 *아닐 수 있음*CPU와 컴파일러가 명령을 재정렬할 수 있기 때문에, Thread 2가 y=1을 보고도 x=0을 볼 가능성이 생깁니다.
Memory model은 어떤 재정렬이 허용되는지를 정의합니다.
#ARM Memory Model — Weak
ARMv7/v8: weakly ordered Load → Load: 재정렬 OK Load → Store: 재정렬 OK Store → Load: 재정렬 OK Store → Store: 재정렬 OKexplicit barrier 없이는 어떤 순서도 보장되지 않습니다.
__DMB(); // 이전 access 모두 완료 보장#x86 Memory Model — Strong
x86 (TSO — Total Store Order):
- Load → Load: in order
- Store → Store: in order
- Load → Store: in order
- Store → Load: 재정렬 가능 (store buffer)
x86은 약한 재정렬만 허용해서 거의 sequential에 가깝지만, ARM과 POWER는 훨씬 자유롭게 재정렬됩니다.
#C11/C++11 Atomic — Memory Order
atomic_store_explicit(&x, 1, memory_order_release);int v = atomic_load_explicit(&y, memory_order_acquire);| Order | 의미 | 비용 |
|---|---|---|
relaxed | 순서 무관 atomic | 가장 싸다 |
consume | data dependency만 (사실상 deprecated) | — |
acquire | read 후 access 재정렬 금지 | 보통 |
release | write 전 access 재정렬 금지 | 보통 |
acq_rel | both | 보통 |
seq_cst | 모든 thread 같은 순서 (sequential consistency) | 비쌈 |
기본값은 seq_cst이고, 안전한 대신 가장 느립니다.
#Acquire-Release Pattern
/* Producer */data = 42;atomic_store_explicit(&ready, 1, memory_order_release);
/* Consumer */if (atomic_load_explicit(&ready, memory_order_acquire) == 1) { use(data); // ← data = 42 보장}Release는 write barrier 역할을, acquire는 read barrier 역할을 합니다. 가장 흔한 lock-free 패턴입니다.
#Sequential Consistency vs Acquire-Release
/* Thread 1 */x.store(1, seq_cst);r1 = y.load(seq_cst);
/* Thread 2 */y.store(1, seq_cst);r2 = x.load(seq_cst);
/* seq_cst: r1==0 && r2==0 *불가* *//* acq_rel: r1==0 && r2==0 *가능* — 양쪽 store가 다른 thread에 *다른 순서*로 보임 */Sequential consistency는 모든 thread가 같은 글로벌 순서를 보게 만드는 모델입니다.
#ARM·POWER에서 SC 비용
ARM: seq_cst store → DMB ISH 명령 추가 (~30 cycle) release store → 더 가벼움 (~5 cycle)
Linux kernel — 대부분 release/acquire 사용.#DMB·DSB·ISB
__DMB(); // Data Memory Barrier — memory access ordering__DSB(); // Data Sync Barrier — *모든* access *완료*까지 대기__ISB(); // Instruction Sync Barrier — pipeline flush, instruction refetchDMB는 atomic과 lock에 사용합니다.
DSB는 clock enable이나 MPU 변경 후에 사용합니다.
ISB는 self-modifying code나 mode change 시점에 사용합니다.
#Concurrent Data Structure
#Lock-based
xSemaphoreTake(mtx, ...);queue.push(item);xSemaphoreGive(mtx);#Lock-free
/* SPSC (single-producer single-consumer) queue */atomic_size_t head, tail;
bool push(T item) { size_t h = atomic_load_explicit(&head, memory_order_relaxed); size_t t = atomic_load_explicit(&tail, memory_order_acquire); if (h - t == CAPACITY) return false; buf[h % CAPACITY] = item; atomic_store_explicit(&head, h + 1, memory_order_release); return true;}Producer와 consumer가 분리되어 있는 경우에는 lock 없이도 안전하게 동작하므로, 더 빠릅니다.
#False Sharing — 다음 편 주제
struct { atomic_int a; // CPU 0 사용 atomic_int b; // CPU 1 사용} stats;같은 cache line에 있으면 update가 일어날 때마다 다른 CPU의 cache를 invalidate시켜 100배까지 느려질 수 있습니다.
#ABA Problem
/* Lock-free stack */T* top;
pop(): T* old = top; // read top = X /* preempt — 누군가 X pop, Y push, X 다시 push */ /* top = X 다시 (그러나 next 다름) */ cas(&top, old, old->next); // ← 성공! 그러나 잘못된 next해결책으로는 tagged pointer (top + version) 또는 hazard pointer를 사용합니다.
#자주 하는 실수
⚠️
volatile로 atomic 가정
volatile int counter;counter++; // ← 여전히 RMW, atomic 아님volatile은 컴파일러의 최적화를 차단할 뿐이고, atomic은 그것과 별개입니다.
⚠️ Lock-free가 항상 빠름
작은 데이터에 낮은 contention 상황에서는 lock과 비슷하거나 오히려 더 느립니다. CAS retry overhead 때문입니다.
⚠️ Memory order 무시
atomic_store(&flag, 1); // default seq_cst → 비쌈atomic_load(&flag); // seq_cst → barrier실제로는 memory_order_release/acquire만으로 충분한 경우가 많습니다.
⚠️ Race condition은 희박해서 무시
Race가 1M 중 1회 발생 → 1 day in production → bugUI bug보다 훨씬 무섭습니다. 재현이 되지 않기 때문입니다.
#정리
- Concurrency는 조직이고, Parallelism은 동시 실행입니다.
- Race condition은 atomic과 memory order의 조합으로 해결합니다.
- ARM과 POWER는 weak memory model이라 explicit barrier가 필요합니다.
- x86은 TSO 모델이라 거의 strong에 가깝습니다.
- C11의
memory_order_*는 상황에 맞게 정확히 선택해야 합니다. - Acquire-release가 seq_cst보다 가볍고 충분한 경우가 많습니다.
다음 편은 False Sharing을 다룹니다.
#관련 항목
Embedded Performance Engineering · 31 of 57
- 1 Embedded Performance Engineering — 임베디드 성능 엔지니어링 시리즈 소개
- 2 임베디드 성능 분석 방법론 — Measure → Analyze → Optimize 사이클
- 3 성능 지표 정의 — Latency·Throughput·Utilization 분석
- 4 성능 측정의 기본 — Wall-Clock·CPU Cycle·Instruction Count
- 5 성능 데이터 통계적 분석 — Percentile·Histogram·평균의 함정
- 6 실시간 성능 분석 — WCET·Jitter·Deadline Miss 측정
- 7 임베디드 벤치마킹 기초 — 재현성·Warmup·노이즈 제거
- 8 성능 모델링 — Amdahl·Gustafson·Roofline Model 적용
- 9 프로파일링 기법 개요 — Sampling vs Instrumentation·PGO·LTO
- 10 CPU 파이프라인 분석 — 5-stage·Cortex-M·Cortex-A 비교
- 11 Pipeline Stall 분석 — Data·Structural·Control Hazard·Forwarding
- 12 Branch Prediction 분석 — Static·2-bit·BTB·BHT·Mispredict 비용
- 13 Speculative Execution 분석 — OoO·Reorder Buffer·Register Renaming
- 14 CPU Cache 기초 — L1·L2·L3·Set Associative·Replacement Policy
- 15 Cache Miss 3C Model 분석 — Compulsory·Capacity·Conflict
- 16 Cache Line 최적화 — Alignment·Prefetch·False Sharing 처리
- 17 메모리 대역폭 분석 — STREAM·Roofline·Bus Saturation 측정
- 18 SIMD·NEON 활용 — 128-bit Vector·Auto-Vectorization·SVE/SVE2
- 19 PMU·HPM 하드웨어 카운터 분석 — 정밀 성능 진단
- 20 임베디드 Bus Architecture — AHB·AXI·CHI 진화와 5-Channel
- 21 Bus Contention 진단 — Arbitration·QoS·Starvation 측정
- 22 DMA 성능 최적화 — Burst·Scatter-Gather·Chain·Cache 일관성
- 23 DMA vs CPU Copy 성능 비교 — Break-even·Setup Overhead 실측
- 24 Interrupt Latency 분석 — 진입·종료·Tail-Chaining·Late Arrival
- 25 Interrupt Storm 처리 — NAPI·Rate-Limit·Polling 전환
- 26 MMIO 접근 성능 — Cache Policy·Write-Combining·Volatile·Barrier
- 27 Peripheral Clock 분석 — PLL·Divider·Gating·DVFS
- 28 Power vs Performance 트레이드오프 — DVFS·Race-to-Idle·Big.LITTLE
- 29 Thermal Throttling 분석 — Junction Temp·Trip Point·냉각
- 30 CXL Interconnect 분석 — AI 시대 메모리 대역폭 확장
- 31 Concurrency 기초 — Concurrency vs Parallelism·Race·Memory Model
- 32 False Sharing 진단 — Cache Line Ping-Pong·Padding·측정
- 33 Lock Contention 분석 — Wait·Hold·Convoy·측정 기법
- 34 Spinlock 성능 분석 — Spin-Wait vs Context Switch·Ticket·MCS
- 35 Mutex 성능 분석 — Futex·Adaptive·Priority Inheritance
- 36 Reader-Writer Lock 성능 — Reader/Writer Priority·RCU·Seqlock
- 37 Lock-Free 자료구조 성능 — CAS·ABA·Hazard Pointer·Epoch Reclamation
- 38 Memory Ordering 분석 — Acquire·Release·Seq-Cst·ARM Relaxed Model
- 39 Cache Coherency 프로토콜 — MESI·MOESI·Snoop·Directory
- 40 SMP 성능 분석 — Per-Core·Affinity·Load Balance·Scalability
- 41 Linux perf 기초 — stat·record·report 활용
- 42 Linux perf 고급 — Raw Event·Tracepoint·perf script
- 43 ftrace 활용 — function·function_graph·latency tracer
- 44 eBPF·bpftrace 동적 트레이싱 — 커널 무수정 관측
- 45 Flamegraph 분석 — On-CPU·Off-CPU·Differential
- 46 ARM DS·Lauterbach 분석 — Hardware Trace 전문 도구
- 47 Bare-metal 프로파일링 — GPIO·DWT·SysTick·ITM 활용
- 48 NVIDIA Nsight Systems — GPU·NPU 포함 시스템 분석
- 49 모던 프로파일러 비교 — Tracy·Hotspot·uftrace·Coz
- 50 연속 프로파일링 — Parca·Pixie·Pyroscope·Tetragon
- 51 실전 사례 — ISR Latency 100µs Deadline Miss 추적
- 52 실전 사례 — Matrix Multiply가 예상의 10배 느린 이유
- 53 실전 사례 — 8-core가 4-core를 넘으면 throughput이 떨어지는 이유
- 54 실전 사례 — 카메라 1080p 60fps가 30fps로 떨어지는 이유
- 55 CXL.mem 지연·대역폭 실측 — Direct·Switch·Pooled 토폴로지 비교
- 56 CXL 성능 프로파일링 도구 — cxl-cli·DAMON·perf-mem 활용
- 57 실전 사례 — CXL.mem 추가로 LLM inference KV cache 처리량 회복
관련 글
False Sharing 진단 — Cache Line Ping-Pong·Padding·측정
False sharing 원인. Cache coherence ping-pong. Padding으로 line 분리. 측정 방법.
같은 시리즈에서 이어 읽기
Lock Contention 분석 — Wait·Hold·Convoy·측정 기법
Wait time과 hold time, contention ratio를 측정하고 lock convoy를 회피하는 법.
같은 시리즈에서 이어 읽기
TSan으로 데이터 레이스 디버깅 — Happens-before 추적
ThreadSanitizer로 멀티스레드 버그 추적 — happens-before 모델, false positive, atomic·mutex 통합.
공통 태그 기반 추천